MTG Data Analysis with Python | Chapter 4, Part 2: 17lands

Introduction
Welcome to the continuation of the fourth installment of Paul’s Tutorial Series!
Today, I am continuing my series on Data Analytics using 17lands and a focus on Jupyter Labs
As a reminder, 17lands is a Magic: The Gathering Arena (digital platform for the original trading card game) tracker. The agent parses every games log and allows for in depth analysis of games, cards impact, format trends and more.
It’s also a dataset that can corroborate or challenge established game theories, dedicated to MTG limited. Trust me, this is not something you care about if you are not a complete nerd.
Luckily I am.
Because there is so much potential, I decided to create a few tutorials to guide people on how to use this dataset, using pandas dataframe (a python library) and Jupyter Labs (an open source notebook).
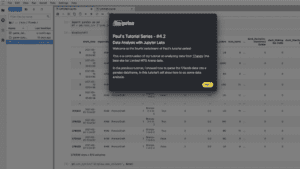
Today’s Tutorial: How to do data analysis with 17lands & Jupyter Labs
To learn how to do that, click on the image below:
That’s about it for this series.
Asides from the very good win percentage of 17lands players, one thing that immediately crosses my mind is how these stats evolve per format. I wouldn’t be surprised if a much more aggressive format where snow is not a part of it has a lower average number of turns, and thus may even exacerbate mulligan impact on win percentage.
Do you want to learn more about 17lands? Check out this link.
Do you have suggestions? Comments? Tech you want me to have a look out? Reach out to me on LinkedIn / Twitter
About Paul’s Tutorial Series
What is it? Every week, I chose a piece of tech that picked my interest, and create an easy to consume tutorial showcasing this tech.
Why do I do it? I’m a huge nerd passionate about tech.
Who is this for? Anyone really. The goal is tech evangelization, without ulterior motive, just love.
What’s the topic for this week? How to analyze 17lands data previously loaded in a pandas dataframe using Jupyter Labs