
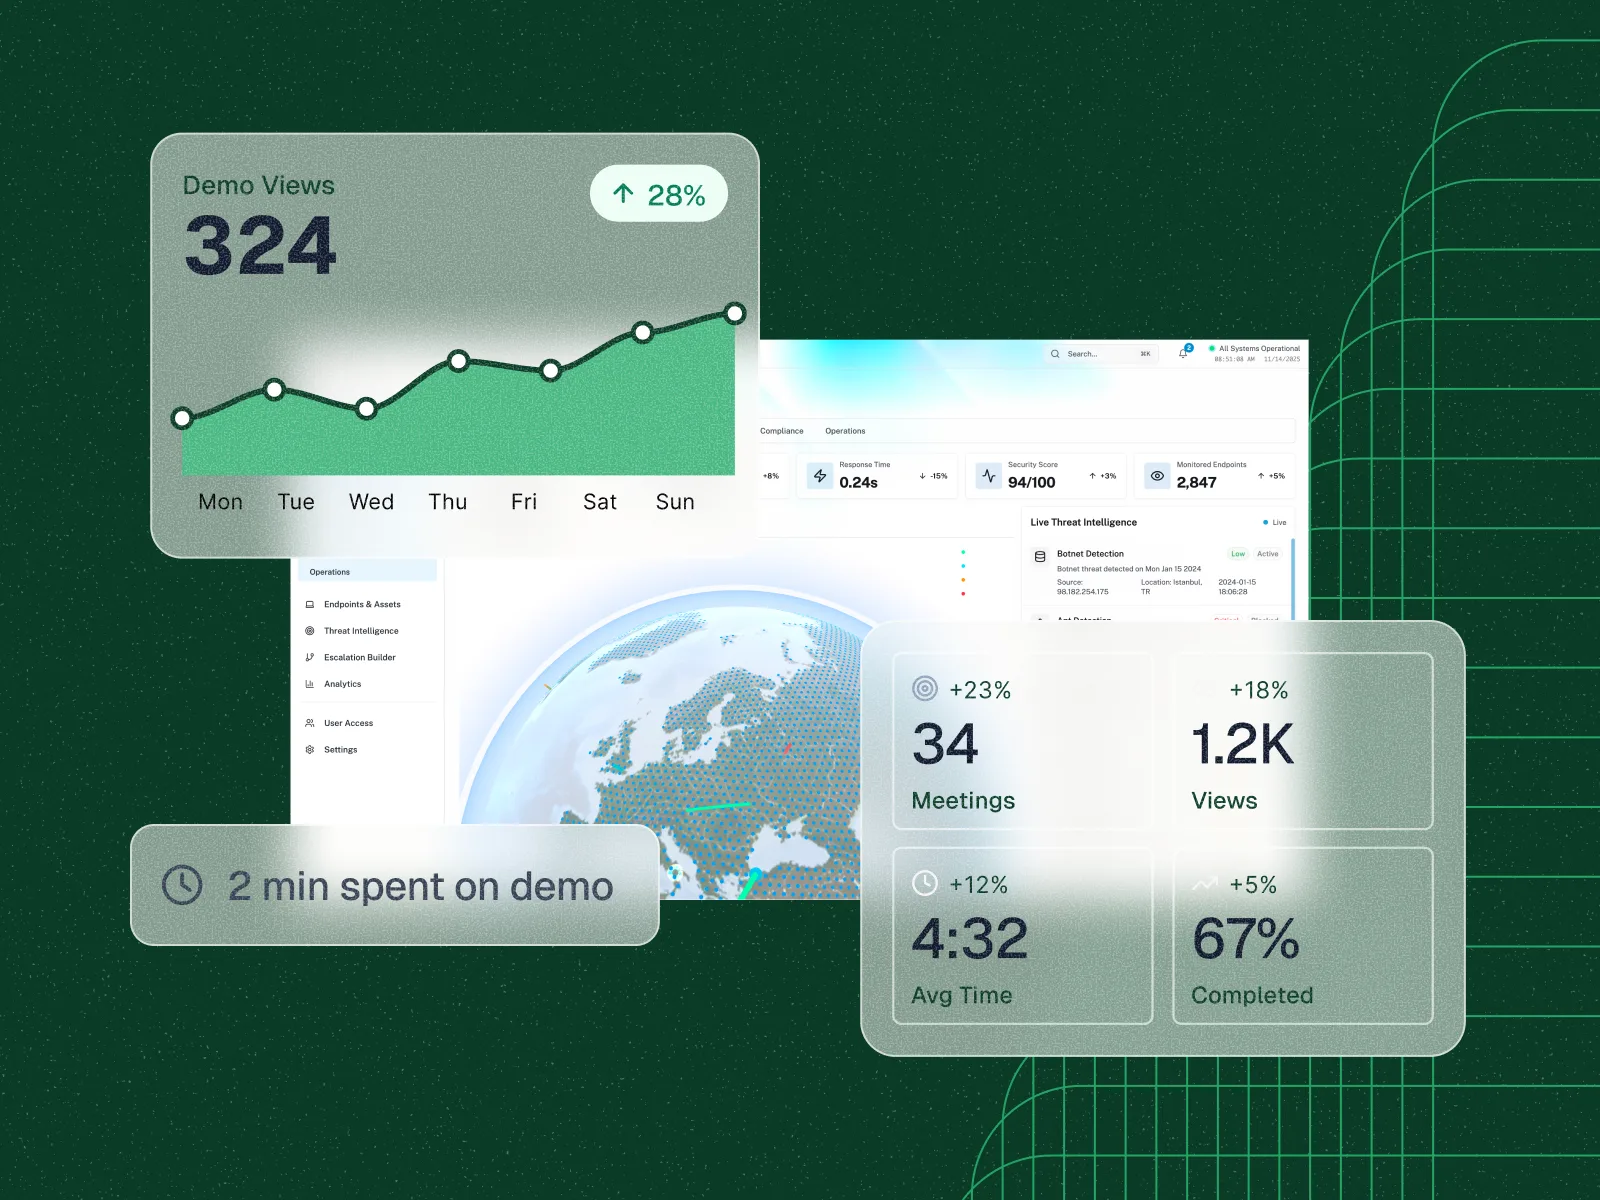
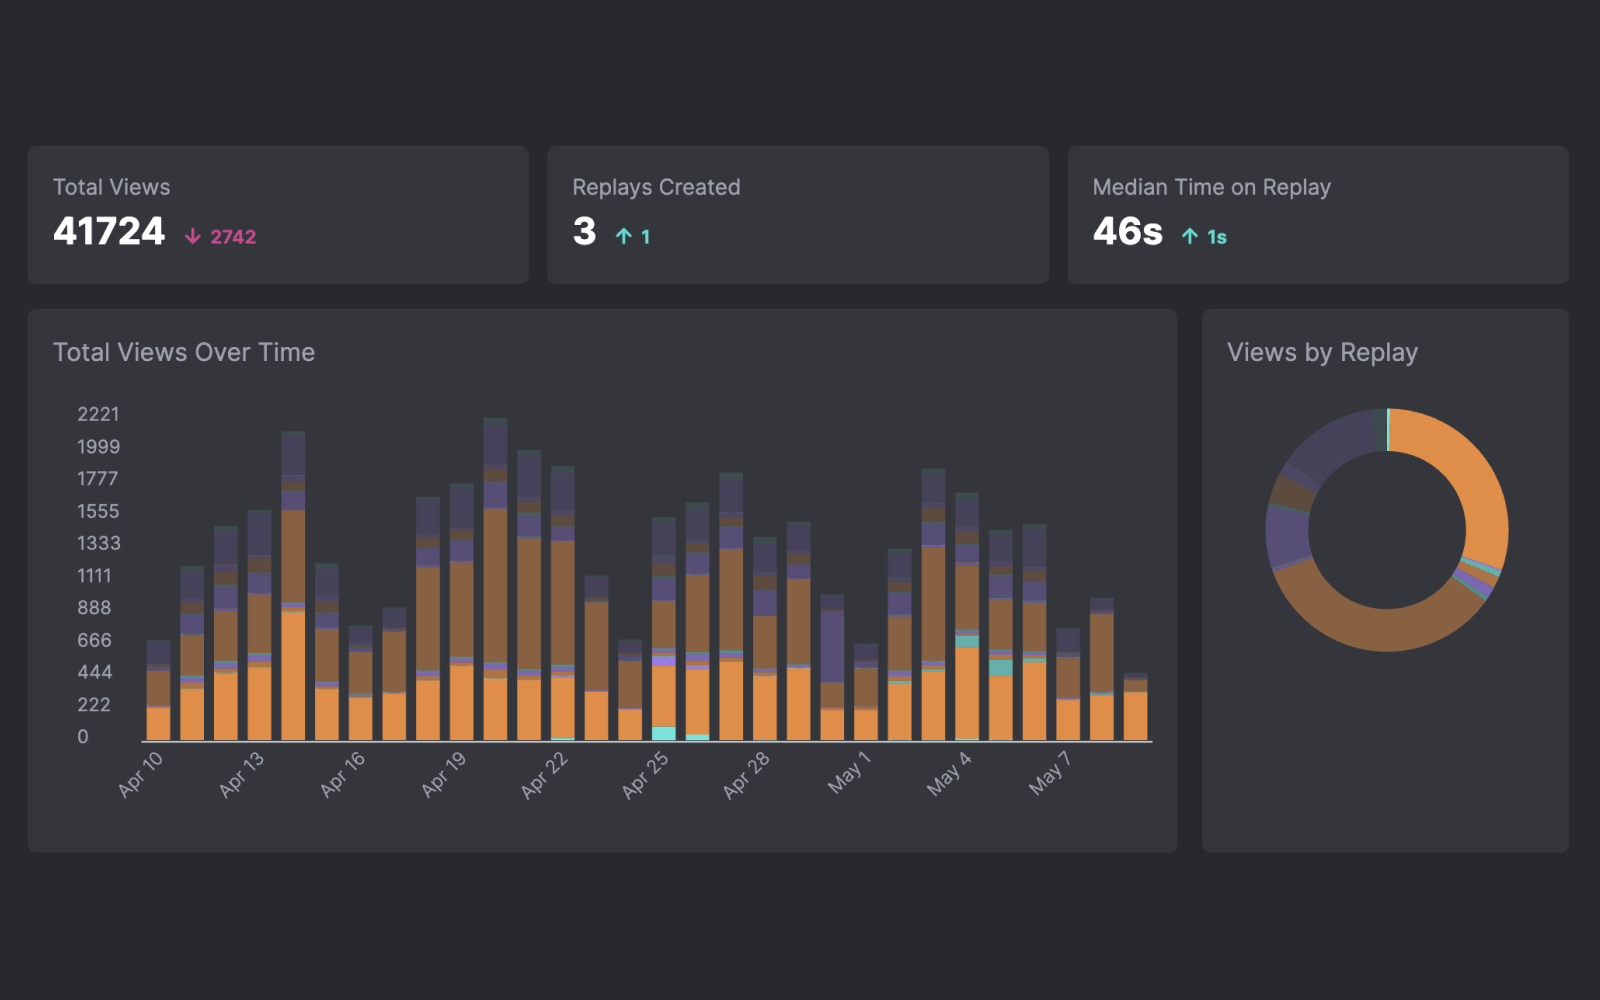
Leverage powerful demo analytics to get a bird's eye view into your demo activity. Reprise provides an easy-to-use analytics dashboard with key metrics, such as total number of views per demo and time spent on each demo.
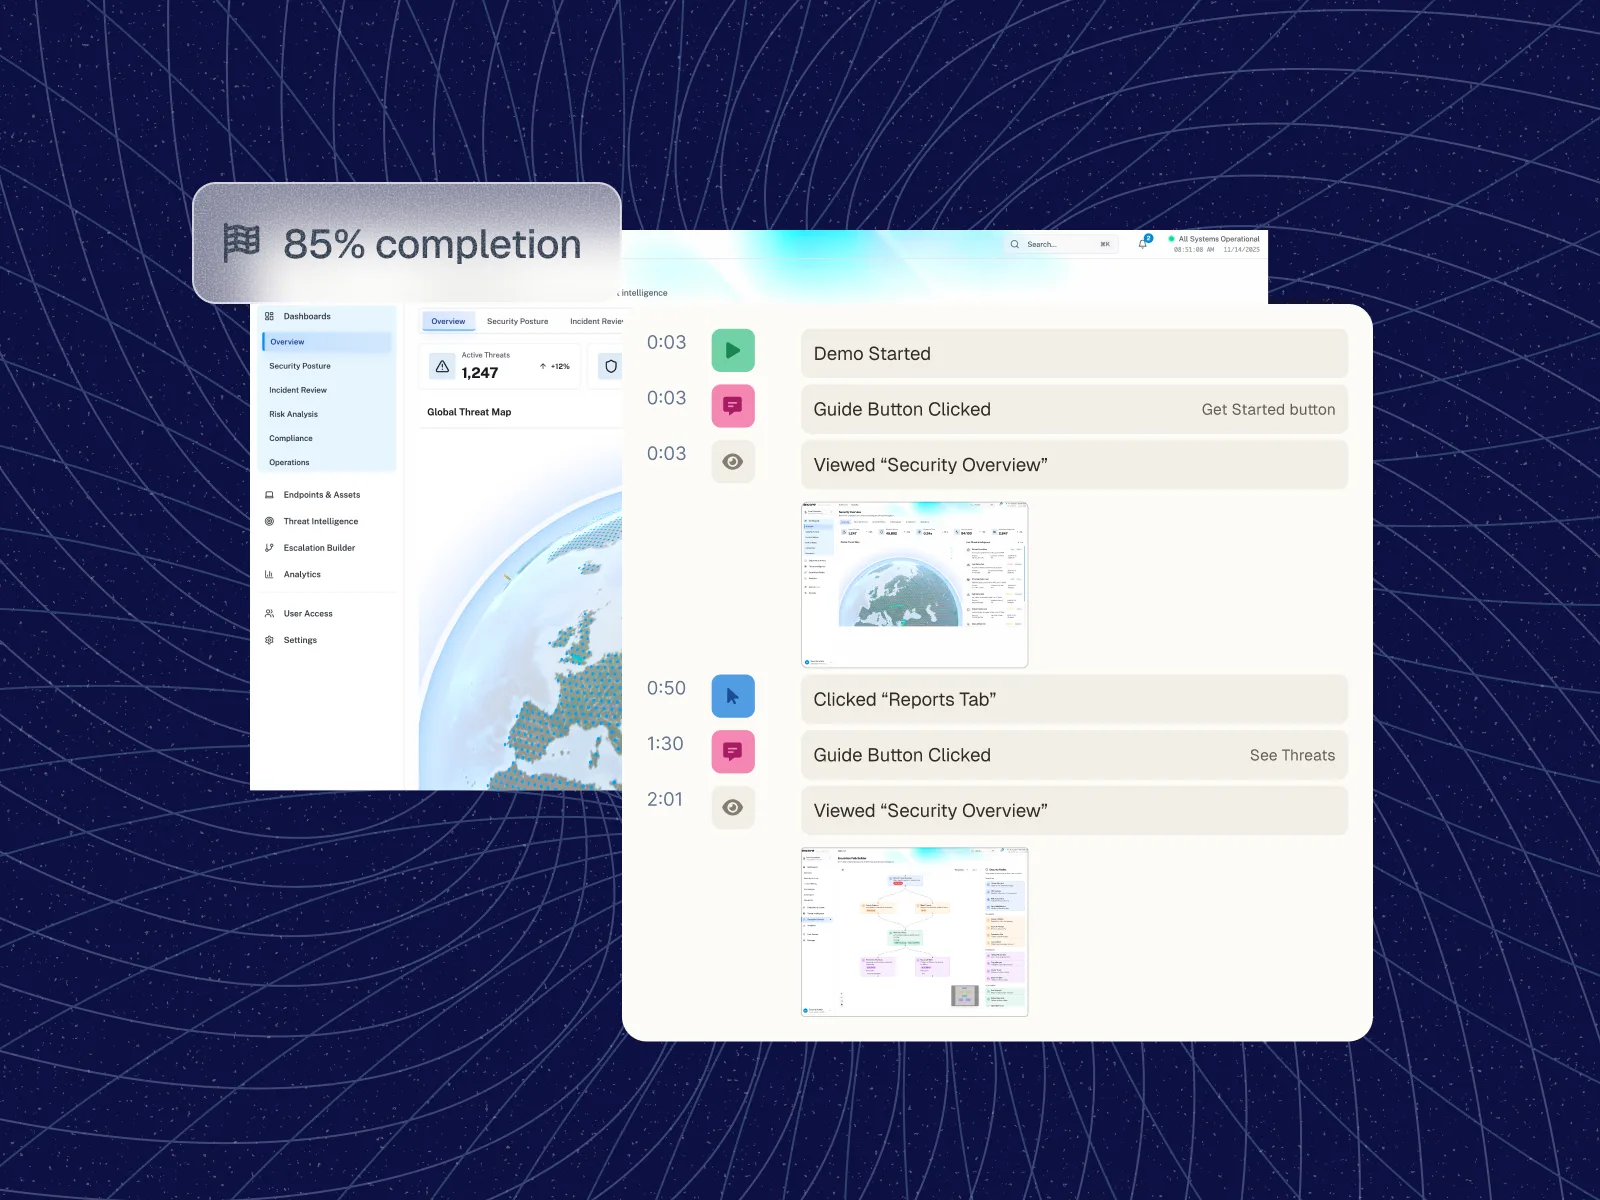
Zoom in to get visibility into individual session data. You have the ability to view individual user activity, which screens they viewed, how long they spent on each screen, and where they dropped off of the demo. When you create a custom sharing link to send to your prospects, you will also get notified when they open it.
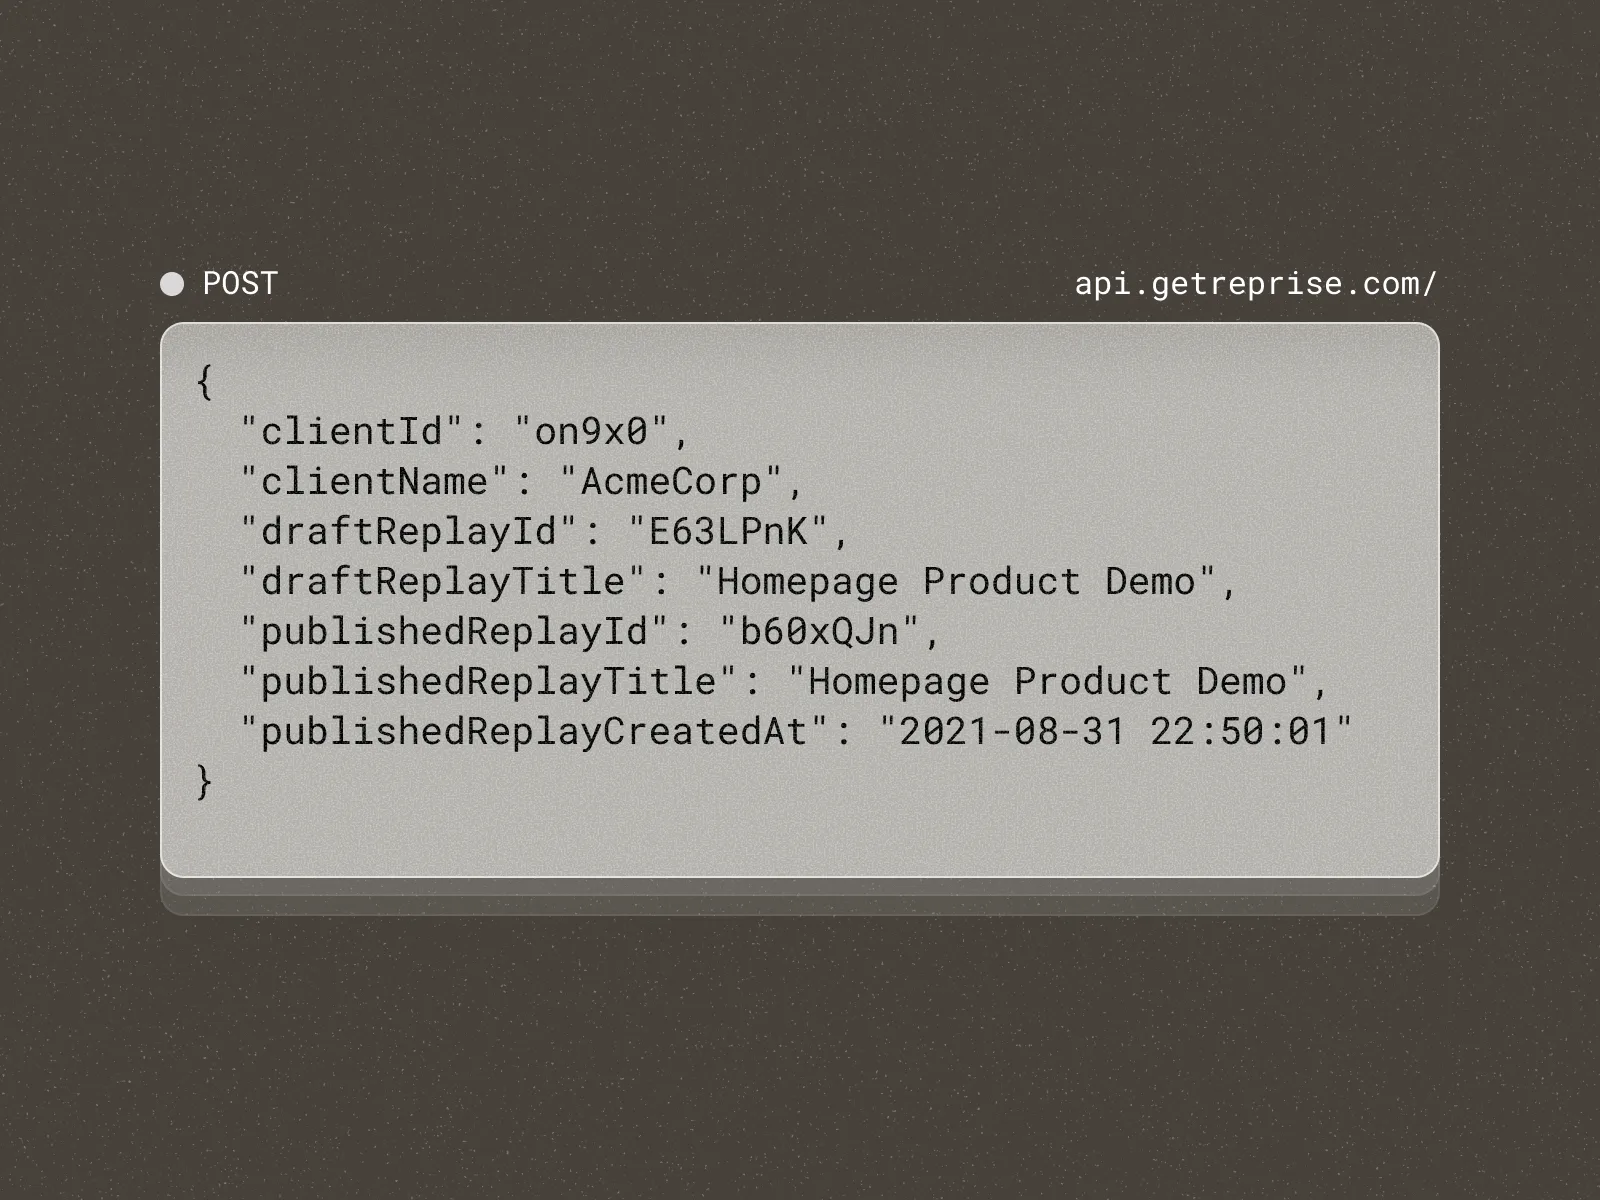
Pull data from Reprise into a data warehouse or data lake, then push to another platform to create or update records. You can also trigger and automate sales or marketing actions based on prospect or customer actions.
Reprise analytics show what happened after a demo went out: who opened it, how long they stayed and how far they got. Views are grouped by Product Tours, Data Injection and Application Clones, each by demo or by viewer.
Every view has summary tiles, a chart of sessions over time and a sortable table, with filters for demo, user, user type, tag and date range.
Yes. The per-session view shows one viewer's path screen by screen: which screens they saw, how long they spent on each and where they left.
Send a custom sharing link and Reprise notifies you when the prospect opens it, so follow-up starts at the right moment.
Yes. Filter any view by user type (internal, external or anonymous) to see prospect activity on its own.
Tags and date ranges narrow it further, for example to one campaign or one quarter.
Analytics cover Product Tours, Data Injection datasets and Application Clones. Demo Flows add journey analytics: which path a buyer chose, which assets they opened and whether they finished or converted.
Every view uses the same controls, so one team can read results across every kind of demo.
Yes. Connectors push demo activity into Salesforce, HubSpot, Marketo and Google Analytics, so engagement shows up where sales and marketing already work.
See Integrations for what each connector does.
Yes. The Analytics Data API pulls session activity and viewer metrics for Product Tours and Application Clones into your data warehouse or BI tools.
From there you can create or update records in other systems, or trigger sales and marketing actions based on what prospects do.
Yes. Through the Reprise MCP, your AI assistant can pull analytics and answer questions such as which demo assets work best at the top of the funnel and which work best in the middle.
The answer comes back in the assistant you already use, built from the same data you see in Reprise.
Drop-off points show which screens lose viewers, and interaction counts show which features hold attention. Teams use both to shorten tours, reorder steps or lead with a stronger story.
Every Reprise demo can be edited after it is published, so the improvement goes out without rebuilding the demo.
