Table of Contents
A Fortune 100 software company asked us a simple question during their evaluation: can Reprise hold 25,000 people inside one demo environment at the same time? We answered with 100,000, four times the ask.
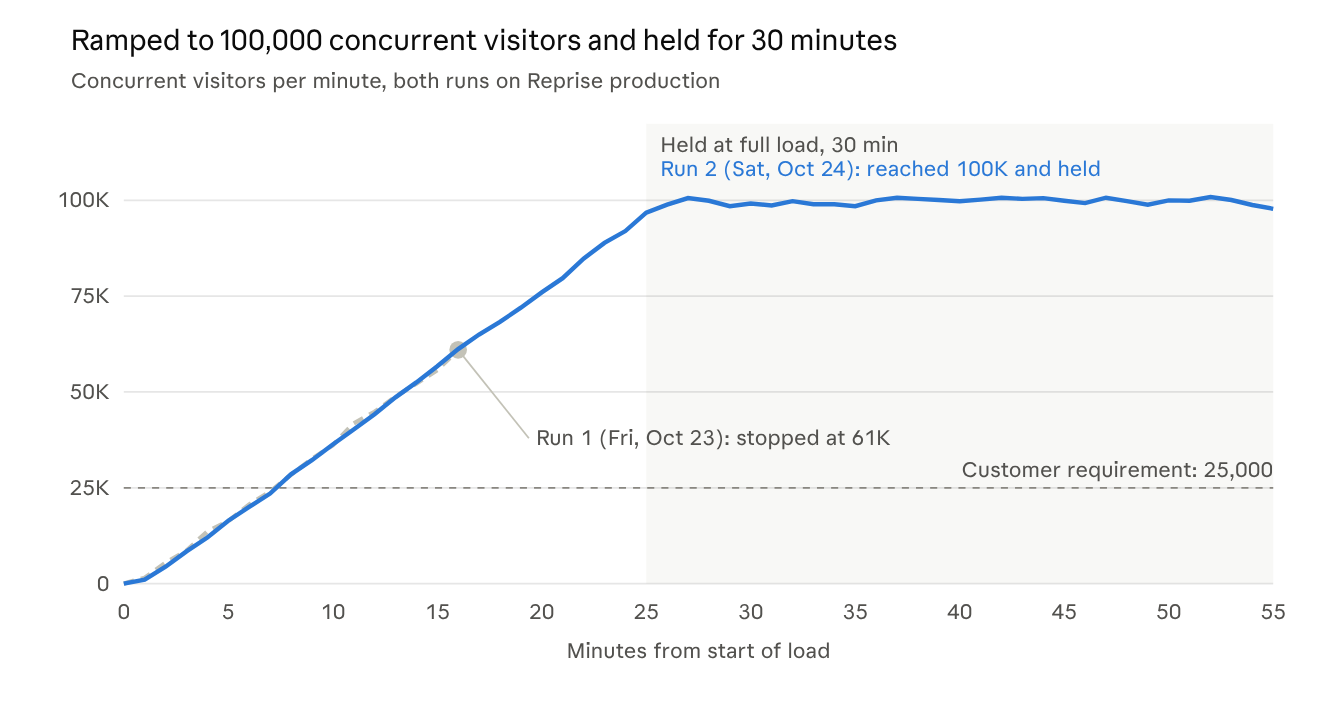
On the night of October 24, 2026, we ramped 100,000 simulated visitors onto a single published demo, on our real production service, and held them there for 30 minutes. Not one visitor failed to load it.
- Peak concurrent visitors: 100,000 (4x the requirement)
- Total test length: 55 minutes (25-minute ramp, 30-minute hold)
- Requests served: 8.7 million
- Demo load failures: 0 of 300,000
- Overall error rate: 0.009%, all in background analytics
- Demo request p95, median minute: 251 ms
- Analytics request p95 during the hold: 98 ms median, 104 ms worst minute
- Manual scaling steps: none
Below: how we ran the test, what broke on the first attempt, and why the numbers matter more now that agents, not just people, are building and opening demos.
Why concurrency is the number that matters
The demo environment in this test is a fully interactive copy of a web application. Anyone can click through it without touching production or a shared demo tenant, and every visitor gets their own isolated session.
That isolation is the point, and it is also what makes scale hard. A video or screenshot tour costs almost nothing per extra visitor. A demo environment is a live, working application for every person who opens it, plus a steady stream of activity events back for analytics. At large enterprises, one demo can be embedded in a hands-on workshop, a partner enablement portal and a field SE's laptop all at once.
The requirement was that it stay fast when tens of thousands of people open it in the same hour.
How we tested
We tested the real thing: the shared, multi-tenant production service that serves every customer's published demos, not a separate staging copy sized for the occasion. The results describe capacity every customer gets, not a one-off build.
- Target: one published demo environment (a Reprise Clone) on production
- Test window: Oct 25, 2026, 02:30–03:25 UTC (evening of Oct 24, US time)
- Load profile: linear ramp from 0 to 100,000 concurrent visitors over 25 minutes, then a 30-minute hold
- Visitor behavior: open the demo, then send an activity report every 30 seconds, as a real browser does
- Load generators: 34 cloud machines across US East, US Central and US West
- Measured at: our load balancer (server side, per minute) and each simulated visitor (client side, including network time)
- Scaling: fully automatic; no one touched capacity during the run
We set pass/fail criteria before the run, not after:
- Visitors who successfully opened the demo: 100%
- Failed requests that load the demo: none
- HTTP 5xx error rate, whole test: below 0.1%
- Analytics request p95, every minute of the hold: below 250 ms
- Demo request p95, median minute: below 500 ms
- Capacity scaling: automatic, no manual action
For anyone running their own test: we derive concurrent visitors from server traffic rather than trusting the load tool. Every active visitor sends exactly one activity report every 30 seconds, so visitors in a given minute equal that minute's analytics requests divided by two. We also reconciled every request the simulated visitors sent, one for one, against the load balancer's request log.
Results: every criterion passed
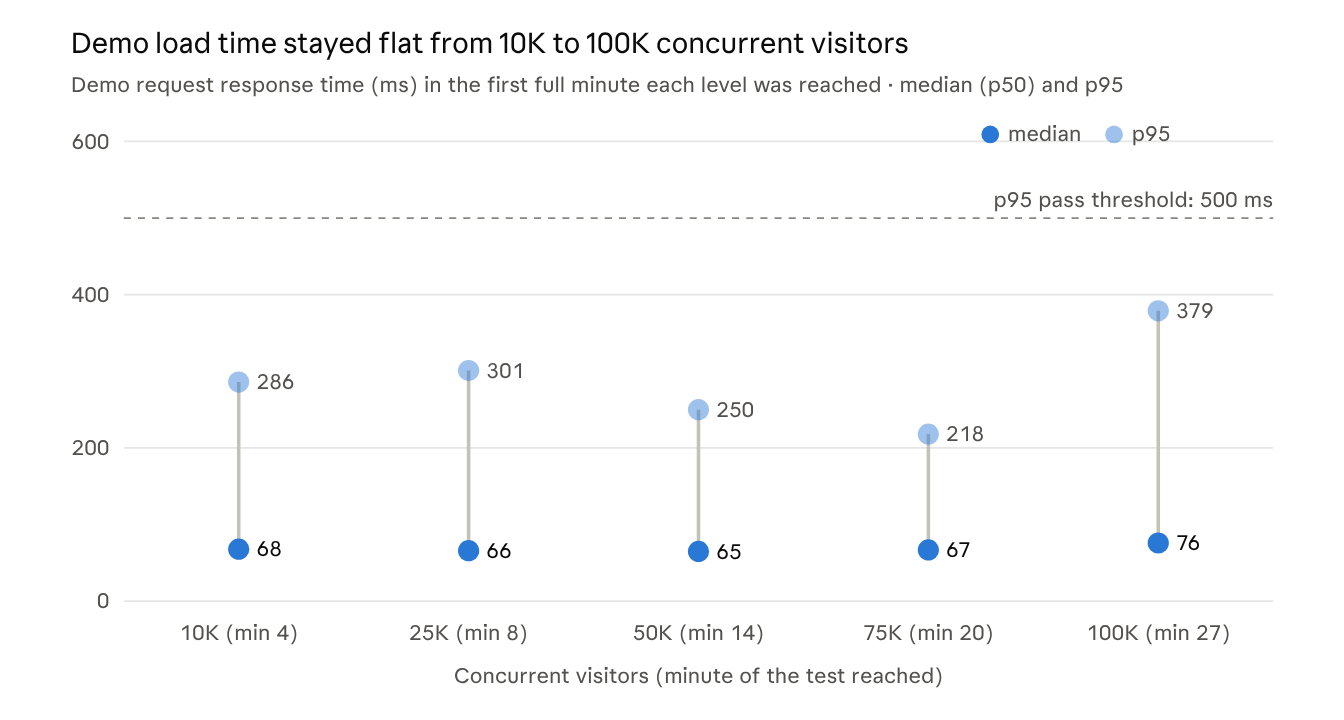
All 100,000 simulated visitors opened the demo, and the median demo response time at 100,000 visitors (76 ms) was within 10 ms of what it was at 10,000.
- Demo requests (opening and running the demo): 298,857 requests, 0 errors, 66 ms median p50, 251 ms median p95, 415 ms worst-minute p95
- Analytics requests (session start and activity): 8,402,164 requests, 747 errors (0.009%), 47 ms median p50, 98 ms median p95, 149 ms worst-minute p95
During the 30-minute hold at full load, the service handled 5.79 million requests with 507 errors (0.009%). Concurrent visitors stayed between 97,796 and 100,906 in every minute. Analytics p50 never left a 46–48 ms band, and p95 never went above 104 ms.
From the visitor's side, including network time, the full time to open the demo had a p50 of 128 ms from US East, 183 ms from US Central and 345 ms from US West. Those differences track network distance to the service, not service behavior.
The tail had two short spikes. Demo request p99 spiked to 2,271 ms in a single minute early in the ramp (minute 6) and was back near 500 ms the next minute. Analytics p99 had one isolated spike to 885 ms during the hold (minute 49). Neither moved p50 or p95.
The first attempt stopped at 61,000
The 100,000 result is the second run. The first, on Friday night, October 23, aimed at the same 100,000 and topped out at just over 61,000 concurrent visitors.
Up to that point the service looked healthy. Over a 16-minute ramp it served 1.18 million requests, 99.99% of them successfully, and the typical demo response stayed between 70 and 72 ms from the first thousand visitors to 61,000. Then a shared data store that every session depends on hit its limit, and the run couldn't climb any further.
- Run 1, Fri, Oct 23: peaked at about 61,000; stopped when the shared data store saturated
- Run 2, Sat, Oct 24: 100,000, held for 30 minutes; passed every criterion
61,000 was already more than twice the 25,000 requirement. We could have stopped there and sent the report. Instead we spent Saturday fixing the bottleneck, then re-ran the full 100,000 that night.
Where the errors were
Every error in the 0.009% was in background analytics. None stopped a visitor from loading or using the demo.
By request type:
- Open and run the demo: 300,000 requests, 0 server errors, no effect on the visitor
- Session start report: 100,000 requests, 5 server errors; no effect, the demo runs either way
- Activity report (clicks, navigation): 8,378,894 requests, 658 server errors; one 30-second activity sample not recorded
The demo loads and runs whether or not an analytics report is recorded, so the worst case for an error here is a slightly undercounted engagement chart, not a broken demo.
A note for anyone comparing totals: the per-minute monitoring metric counted 747 errors and the request log counted 663, because they are different instruments. We report the larger number in the headline. We count rejected activity for sessions that never started separately, since that's the service correctly declining bad input, not failing.
What this means if you're building with agents
More and more demo environments are built by agents, not by hand. Through the Reprise MCP server, an agent can capture an app, build a demo, customize its data and publish it, then hand back a link. That changes the load profile: one agent can publish a demo per prospect, per workshop seat or per test case, and every one of those links can be opened at once. The demo type in this test was a Clone, Reprise's fully interactive copy of a web app, where every visitor gets a live, working session rather than a recording.
A few properties from this test that an agent (or the person supervising one) can plan around:
- Capacity is shared and elastic. Every published demo runs on the same production service that held 100,000 concurrent visitors, with capacity added automatically. An agent doesn't need to pre-provision anything before sharing a link widely.
- Opening a demo is fast and predictable. Median demo request time stayed between 65 and 76 ms at every concurrency level we measured, and p95 stayed under 400 ms. An agent driving a demo in a browser can treat load time as roughly constant rather than a function of how busy the platform is.
- Each session is isolated. 100,000 sessions ran side by side without sharing state with one another or touching the source application. An agent can click, submit and break things in a demo without side effects anyone else sees.
- Analytics are best-effort; the demo is not. Loading and using a demo had zero failures. If an agent reads engagement data back, it should treat a tiny fraction of activity samples as possibly missing under extreme load.
If you're designing an agent workflow that fans out demos, the bottleneck is unlikely to be us.